The Cost of a Losing Streak: How Trading Fees Compound Your Drawdown
During a losing streak, spread, commission and swap are charged on every trade regardless of outcome, adding a fixed cost drag on top of the market loss — and since drawdown recovery is nonlinear, that extra drag increases the recovery gain needed by more than the dollar amount alone suggests.
By CB-Dogs Editorial4 min read
Disclosure: CB-Dogs receives an advertising (referral) fee — sometimes called an IB commission — from brokers for accounts opened or linked through us, and returns part of it to you as cashback, the same model used by cashback and points sites. This does not change your trading costs.
On this page
A losing streak is usually described purely in terms of the market losses — ten losing trades, some dollar amount down. What that framing leaves out is that spread, commission and swap are charged on every one of those ten trades regardless of the outcome, adding a fixed cost on top of the market loss. This guide walks through how much that fixed drag actually adds to a drawdown, and why the recovery math makes it matter more than it first appears.
Key takeaways
- Trading costs (spread, commission, swap) are charged on every trade whether it wins or loses, so a losing streak's real damage is market loss plus cumulative cost drag, not market loss alone.
- Drawdown recovery is nonlinear: the percentage gain needed to get back to even grows faster than the drawdown percentage itself, so a small increase in drawdown from cost drag has an outsized effect on the recovery required.
- A rebate is credited on qualifying lot volume regardless of whether the underlying trade won or lost, so it's one of the few things in this equation that doesn't scale with losses — but it typically offsets only part of the cost drag, not the market loss itself.
- Cost drag is a fixed, quantifiable amount you can calculate in advance; the market-loss side of a losing streak is not.
- None of this changes trading strategy or risk management directly — it's a reason to track and minimize the fixed cost side of a losing period, since it's the one part you have some control over.
The two components of a losing streak's damage
Every closed trade in a losing streak removes money from the account in two separate ways: the market loss itself (however much the position moved against you, at your position size), and the trading cost on that trade (spread, commission, and any swap), which is charged whether the trade wins or loses. The formula for that second piece is the same one covered in how to calculate your real monthly forex trading cost — it doesn't pause or discount itself just because a streak is going badly.
A worked example, start to finish
Take a hypothetical 10-trade losing streak, on a $2,000 account:
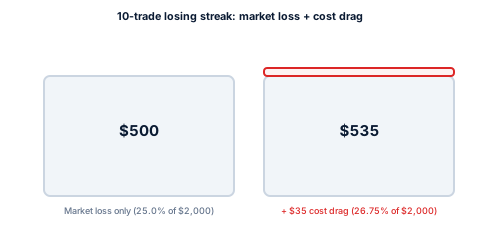
- Market loss: $50 risked and lost per trade × 10 trades = $500.
- Trading cost: an illustrative $3.50 per-trade cost (spread + commission + swap, using the same figure as the monthly-cost worked example) × 10 trades = $35.
- Total drawdown: $500 + $35 = $535, or 26.75% of the $2,000 starting balance.
Without the cost drag, the drawdown would be $500, or exactly 25.0%. The $35 difference looks small in isolation — it's the next step that shows why it isn't.
All figures here are rounded, illustrative assumptions used to demonstrate the calculation — not a prediction of any real trading outcome.
The recovery math gets worse, not linear
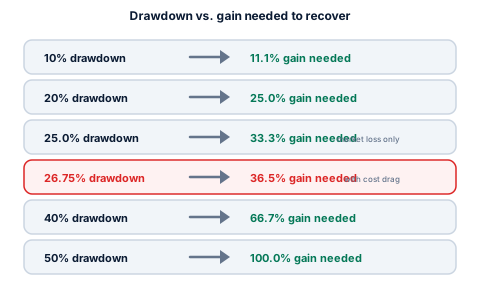
Required recovery gain (%) = Drawdown (%) ÷ (1 − Drawdown (%)).
| Drawdown | Gain needed to recover |
|---|---|
| 10% | 11.1% |
| 20% | 25.0% |
| 25.0% (market loss only) | 33.3% |
| 26.75% (with cost drag) | 36.5% |
| 40% | 66.7% |
| 50% | 100.0% |
The cost drag in the worked example above pushed drawdown from 25.0% to 26.75% — a 1.75-percentage-point increase — but the recovery gain needed went from 33.3% to 36.5%, a 3.2-percentage-point increase. Because the recovery formula divides by a shrinking denominator as drawdown grows, the same dollar amount of extra drag has a bigger effect on recovery the deeper the drawdown already is.
Why cost drag matters more the longer a streak runs
Market losses on a losing streak are unpredictable in size and don't compound in any fixed way — a string of ten losses could be small or large depending on position sizing and how the market moved. Cost drag, by contrast, is close to fixed and fully predictable: it's your average per-trade cost, multiplied by however many trades are in the streak. That predictability cuts both ways — it's the one part of a losing streak's damage you can calculate in advance and the one part you have real influence over, through position sizing, trade frequency, and account-type choice (see how to reduce forex trading costs), rather than a random outcome that depends on where the market goes next.
How a rebate offsets part of this — not all of it
A cashback rebate is credited on qualifying closed lot volume regardless of whether the underlying trade won or lost, which is exactly what makes it relevant here: it's one of the few figures in this whole equation that doesn't get worse during a losing streak. In the worked example above, if the ten trades totaled 3.0 lots and a hypothetical rebate credited $3 per lot, that's $9 credited back — offsetting roughly a quarter of the $35 cost drag, not the $500 market loss itself. This mirrors the mechanics covered in how cashback lowers your break-even win rate, applied specifically to a losing period rather than to an average trade.
Practical takeaway
- Calculate your own cost-drag figure in advance, using your account's real spread, commission and swap, so you know exactly how much a streak of a given length costs before it happens.
- Track cost drag separately from market loss in your own records — see a trading journal template that tracks costs and rebates — so a review of a bad month shows you both numbers, not one combined figure.
- Don't treat a rebate as a fix for a losing system. It reduces the fixed-cost side of the equation; it has no effect on the market-loss side, which is the larger of the two in almost every realistic scenario.
- Remember the recovery curve is nonlinear — a deeper drawdown needs a disproportionately larger gain to recover, which is a reason position sizing and risk-per-trade limits matter more as a losing streak extends, not less.
Frequently asked questions
It adds a smaller, fixed amount on top of the market loss — usually much smaller than the market loss itself — but because drawdown recovery is nonlinear, that extra amount increases the percentage gain needed to recover by more than its dollar size alone suggests.
Next steps
Work out your own average per-trade cost with how to calculate your real monthly forex trading cost, then see how a rebate applies to your volume with the cashback calculator, or register with CB-Dogs so your qualifying lots start earning cashback.
Risk warning: forex and CFD trading carries a high risk of losing money. Cashback does not offset trading losses. Nothing here is investment advice.
Related articles
Cashback on your XM trades — free, paid in USDT
Sign up free