How to Read a Forex Broker's Execution Statistics (Slippage and Fill Rates)
Broker execution statistics typically report average slippage, the split between positive and negative slippage, fill rate, and rejection rate — useful for judging execution quality, but broker-reported and not directly comparable across brokers without knowing the methodology.
By CB-Dogs Editorial4 min read
Disclosure: CB-Dogs receives an advertising (referral) fee — sometimes called an IB commission — from brokers for accounts opened or linked through us, and returns part of it to you as cashback, the same model used by cashback and points sites. This does not change your trading costs.
On this page
Some forex brokers publish a monthly or quarterly execution-quality report on their website — a page of statistics with names like average slippage, fill rate, and rejection rate. Most traders skim past it. This guide explains what each figure actually means, what it can and can't tell you, and how it relates to (but is separate from) the trading costs and cashback rebates covered elsewhere on this site.
Key takeaways
- Execution statistics typically cover average slippage, the share of orders with positive vs. negative slippage, fill rate, and rejection or requote rate.
- These figures are broker-reported and aggregated across all clients — they describe typical outcomes, not a guarantee for any individual order.
- A good-looking headline number can still hide meaningful detail, such as slippage during high-volatility news windows being averaged in with calm-market fills.
- Execution statistics measure order-fill quality, which is separate from spread, commission, and swap costs, and separate again from cashback rebate eligibility.
- Comparing two brokers' published statistics is only meaningful if you know both use a similar measurement methodology and reporting period — otherwise the comparison isn't like-for-like.
What execution statistics actually measure
Execution-quality reporting exists to answer one narrow question: when a client sent an order, how closely did the broker's system fill it at the requested price, and how often did it fill at all? That's a different question from "how much did this trade cost me" — spread, commission, and swap answer that one, and are covered in lot, pip, and spread cost explained. Execution statistics sit alongside those costs, not in place of them.
The four figures you'll usually see
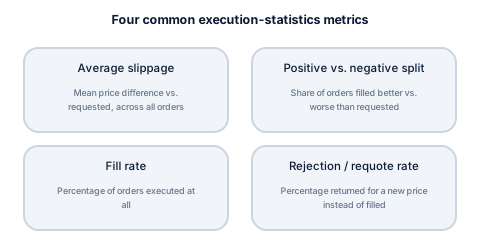
- Average slippage — the average difference, usually in a fraction of a pip or in a dollar amount per lot, between the requested price and the filled price, across all orders in the reporting period. See slippage and requotes explained for what slippage is and why it happens.
- Positive vs. negative slippage share — what percentage of orders filled at a better price than requested (positive) versus a worse price (negative). A healthy report usually shows a meaningful positive share, not just a low negative-slippage number, since a broker could theoretically report "low average slippage" while still filling almost everything slightly against the client.
- Fill rate — the percentage of orders that executed at all, as opposed to being rejected or requoted. This matters most for orders sent during fast-moving markets, where a low fill rate can mean missed entries or exits regardless of price.
- Rejection or requote rate — how often an order was returned to the client for a new price rather than filled, broken out separately from slippage because a requote is a decision point for the trader, not just a price outcome.
Reading a sample report line
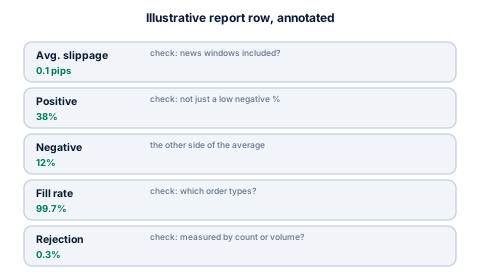
Take a hypothetical line: average slippage 0.1 pips, 38% of orders positive, 12% negative, fill rate 99.7%, rejection rate 0.3%. Read in isolation, that looks strong. Reading it properly means asking a few follow-up questions: does the average include or exclude high-volatility news windows (a broker that excludes them is describing typical, not worst-case, execution)? Is the fill rate measured across all order types, or only market orders (limit and stop orders behave differently, see forex order types and their cost implications)? And over what period was this measured — a single strong month isn't the same claim as a rolling year.
What execution statistics don't tell you
A good execution-quality report doesn't tell you anything about spread width, commission, or swap rates — those are separate, and a broker can have excellent fill rates alongside wide spreads, or vice versa. It also doesn't tell you anything about cashback eligibility: qualifying volume for a rebate is based on closed lots, not on how well any individual order filled. See how to verify your rebate volume from trade history for the volume side of that separate calculation.
It's also worth remembering these figures are self-reported by the broker, aggregated across an unknown mix of clients, instruments, and market conditions. They're a useful transparency signal — a broker willing to publish this at all is disclosing more than one that publishes nothing — but they aren't independently audited in the way a financial statement typically is.
A short checklist for reading any execution report
- Check the reporting period and whether high-volatility windows are included or excluded.
- Look at the positive/negative slippage split, not just the average — a near-zero average can still hide an even mix of gains and losses, or a small negative skew offset by a few large positive outliers.
- Note whether fill rate and rejection rate are broken out by order type.
- Confirm the methodology (per-order-count vs. per-volume) before comparing two brokers' numbers side by side.
- Treat the report as one input alongside spread, commission, and swap — not a replacement for comparing total cost per lot, covered in how to compare two brokers' total cost with rebates included.
Frequently asked questions
Not necessarily — execution quality and pricing (spread, commission, swap) are separate things. A broker that publishes execution statistics is disclosing more about fill quality, which is a positive transparency signal, but it says nothing on its own about that broker's actual spread or commission levels.
Next steps
See slippage and requotes explained and forex order types and their cost implications for the mechanics behind these statistics, and how to verify your rebate volume from trade history for the separate volume-reconciliation side of your own trading. Register with CB-Dogs to start earning cashback on your qualifying volume regardless of any individual order's execution outcome.
Risk warning: forex and CFD trading carries a high risk of losing money. Cashback does not offset trading losses. Nothing here is investment advice.
Related articles
Cashback on your XM trades — free, paid in USDT
Sign up free