How to Compare Forex Account Types With a Simple Spreadsheet Method
Comparing forex account types accurately means plugging your own average lot size, trade count, and holding pattern into a simple one-row-per-account-type spreadsheet with spread, commission, swap, and rebate columns — rather than relying on a generic answer built on a trading pattern that might not be yours.
By CB-Dogs Editorial6 min read
Disclosure: CB-Dogs receives an advertising (referral) fee — sometimes called an IB commission — from brokers for accounts opened or linked through us, and returns part of it to you as cashback, the same model used by cashback and points sites. This does not change your trading costs.
On this page
- The short answer
- Step 1: gather your own inputs first
- Step 2: set up the column structure
- Step 3: a worked, illustrative example
- Common mistakes when comparing
- Adding a sensitivity check
- When this method doesn't fit as well
- Keeping the sheet useful over time
- Related reading
- Frequently asked questions
- Work out your own numbers
Our guide to raw spread vs. standard accounts gives a break-even formula for exactly two account types. This article generalizes that into a reusable spreadsheet method for comparing any number of account types — Standard, Raw/ECN, Zero, Cent, or others — using your own actual trading pattern rather than a generic industry assumption.
Key takeaways
- A generic 'which account type is cheaper' answer assumes a trading pattern — your own average lot size, trade frequency, and holding time can shift the answer entirely.
- A simple spreadsheet with one row per account type and the same set of cost and rebate columns turns the comparison into an actual calculation instead of a guess.
- The inputs worth gathering first are your own average lot size, trades per month, typical overnight holding, and instrument mix — pulled from your own trading history, not an assumption.
- Net monthly cost (spread cost + commission + swap − rebate) is the column that actually matters for the comparison, not any single cost line viewed in isolation.
- The sheet is a one-time (or occasional) decision-support tool, distinct from an ongoing trading journal that logs every trade as it happens.
The short answer
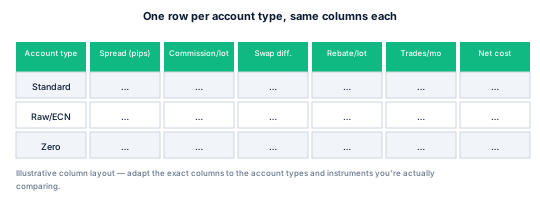
Build one row per account type you're considering, with the same columns for each: typical spread, commission per lot, swap difference (if relevant), rebate per lot, and your own trade count and lot size. Multiply through to a net monthly cost per account type, then compare the bottom-line numbers directly, rather than comparing a single line item like "spread" in isolation.
Step 1: gather your own inputs first
Before opening a spreadsheet, pull together a few numbers about your own trading, ideally from your actual account statement rather than a rough guess:
- Average lot size per trade. Covered in our lot size calculator guide if you need the formula.
- Number of trades per month. Your own typical frequency, not an industry average.
- Typical overnight holding. Whether you usually close same-day or hold positions overnight, since that determines whether swap belongs in the comparison at all — see our overnight vs. intraday trading costs guide.
- Instrument mix. Mostly major forex pairs, gold, or something else, since typical spread and commission both vary meaningfully by instrument.
Step 2: set up the column structure
| Column | What goes in it |
|---|---|
| Account type | Standard, Raw/ECN, Zero, Cent, etc. |
| Typical spread (pips) | From the broker's contract specification for your main instrument |
| Commission per lot | Round-turn or per-side — see our commission per lot guide |
| Swap difference | Only if you hold overnight regularly; otherwise leave blank or zero |
| Rebate per lot | From the current rate table for that broker and account type |
| Your trades/month | The same figure across every row, so the comparison is apples to apples |
| Net monthly cost | (Spread cost + commission + swap) − rebate, at your own volume |
Using the same trade count and lot size across every row is what makes the comparison fair — the whole point is holding your own trading pattern constant and only changing the account type's cost structure.
Step 3: a worked, illustrative example
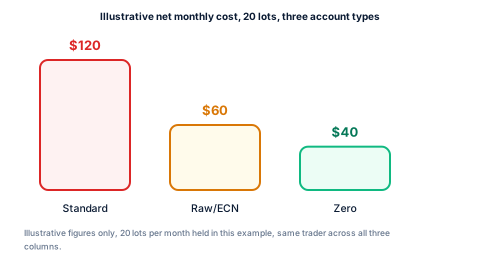
Illustrative inputs: 20 lots traded in a month, no overnight holding (swap excluded from this example).
| Account type | Spread cost (illustrative) | Commission | Rebate | Net monthly cost |
|---|---|---|---|---|
| Standard | $220 | $0 | −$100 | $120 |
| Raw/ECN | $60 | $140 | −$140 | $60 |
| Zero | $20 | $180 | −$160 | $40 |
| Account type | Rebate / lot (USDT) |
|---|---|
| StandardSpread-based account, no commission. | 9.0 |
| MicroRebate is calculated per 100,000 units of micro-lot volume (i.e. the same per-lot rate as Standard, scaled to micro-lot size). | 9.0 |
| Ultra LowLower spreads, spread-based account, no commission. | 3.0 |
| KiwamiXM's tightened-spread account tier available in select regions. | 6.0 |
| ZeroCommission-based account. Rebate is paid in addition to the raw spread — commission you pay is unaffected. | 4.5 |
Provisional rate
In this particular illustrative case, the account type with the lowest headline spread (Zero) comes out cheapest overall once commission and rebate are both factored in — but that ranking is a function of the specific numbers plugged in, not a rule that a lower-spread account type always wins. Change the trader's trade count, average lot size, or the specific rebate rates, and the ranking in your own sheet can shift.
Common mistakes when comparing
- Using a broker-wide average spread instead of your own instrument mix. A published "as low as" spread figure usually refers to one specific major pair under ideal conditions, not necessarily what you'll see on the instruments you actually trade.
- Ignoring a per-trade minimum commission. Some account types charge a minimum commission per trade regardless of lot size, which matters more if your average lot size is small — see our guide to commission per lot, round turn vs. per side.
- Forgetting that rebate rate can differ by account type. As covered in our guide to per-lot vs. percentage cashback, the rebate side of the sheet isn't necessarily the same number across every account type at the same broker.
- Comparing gross cost instead of net cost. The column that matters for a decision is net monthly cost after rebate, not spread cost or commission viewed on its own.
Adding a sensitivity check
Once the basic sheet is built, one more useful step is checking how sensitive the ranking is to a change in your own assumptions — what happens to net monthly cost per account type if your trade count doubles, or if your average lot size drops. Duplicate each row with the adjusted trade count or lot size and recompute; if the ranking between account types stays the same across a reasonable range of your own likely volume, that's a more robust conclusion than one based on a single assumed month. If the ranking flips somewhere within a range you'd realistically expect to trade, that's worth knowing before committing to an account type based on only one scenario.
When this method doesn't fit as well
The spreadsheet method above assumes a fairly steady, comparable trading pattern across the account types being compared. It fits less cleanly for a trader whose strategy depends on a feature specific to one account type rather than pure cost — for example, an EA or algo trader, covered in our forex trading costs for EA and algo traders guide, might need to weigh execution-speed or VPS-compatibility differences alongside the pure cost comparison, not instead of it. In those cases, treat the spreadsheet's net-cost column as one input among a few, rather than the sole deciding factor.
Keeping the sheet useful over time
This spreadsheet is a decision-support tool, best revisited whenever your trading pattern changes materially (a shift in average lot size, a new instrument, or a broker rate change) rather than something to build once and forget. It's a different kind of document from an ongoing trading journal, covered in our trading journal template for costs and rebates, which logs every individual trade as it happens — this sheet instead uses summary averages to answer a single, occasional question: given how I actually trade, which account type comes out ahead right now?
Related reading
- Raw spread vs. standard account: which is cheaper? — the underlying two-way break-even formula this spreadsheet method generalizes.
- Per-lot vs. percentage cashback: how rebate calculations differ — why the rebate column can differ by account type.
- How to read a forex trade confirmation and account statement — where to pull your own real spread, commission, and swap inputs from.
Frequently asked questions
A generic comparison assumes a trading pattern — average lot size, trade frequency, holding time — that may not match your own. Building your own sheet with your own inputs gives an answer specific to how you actually trade.
Work out your own numbers
Build your own version of the sheet above using your real trade count, lot size, and the current rate table for the account types you're considering. To see how qualifying volume adds up on your own pattern, try the cashback calculator, or register with CB-Dogs before your next trade.
Risk warning: forex and CFD trading carries a high risk of losing money. Cashback does not offset trading losses. Nothing here is investment advice.
Related articles
Cashback on your XM trades — free, paid in USDT
Sign up free