How to Estimate Your Total Slippage Cost Over a Month of Trading
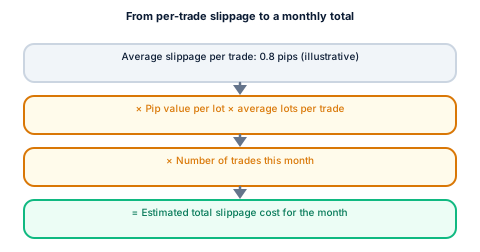
Monthly slippage cost is estimated as average slippage per trade (in pips) multiplied by pip value per lot, multiplied by average lot size, multiplied by number of trades that month — a rough estimate, since real slippage varies trade by trade, but useful for seeing its size relative to spread, commission and swap.
By CB-Dogs Editorial6 min read
Disclosure: CB-Dogs receives an advertising (referral) fee — sometimes called an IB commission — from brokers for accounts opened or linked through us, and returns part of it to you as cashback, the same model used by cashback and points sites. This does not change your trading costs.
On this page
- The short answer
- Why estimate this at all
- Building the estimate step by step
- Where slippage sits next to your other costs
- A second way to sanity-check the estimate
- Tracking this in your own trading journal
- Ways to reduce the estimate, not just calculate it
- Does a rebate offset this cost?
- Related reading
- Frequently asked questions
- Work out your own numbers
Our guide to slippage and requotes covers what slippage is and how to calculate it on a single trade. This article takes the next step: turning that per-trade figure into a rough estimate of how much slippage adds up to across a full month of trading, so you can see its size relative to the costs you already track — spread, commission, and swap.
Key takeaways
- Monthly slippage cost (estimate) = average slippage per trade (pips) × pip value per lot × average lots per trade × number of trades that month.
- This is a rough estimate, not a precise figure — actual slippage varies trade by trade and can be positive (a better fill) as often as negative, depending on conditions.
- Slippage is usually the smallest and least predictable line item in a monthly cost breakdown, but it isn't always negligible for high-frequency or news-sensitive strategies.
- The most reliable source for your own average slippage is your broker's execution or trade-history data, not an industry-wide assumption.
- A cashback rebate is calculated on qualifying closed lot volume, not fill price, so it doesn't offset slippage directly — but it does reduce your combined monthly cost overall.
The short answer
Estimated monthly slippage cost = Average slippage per trade (pips) × Pip value per lot × Average lots per trade × Number of trades that month.
This produces a rough estimate, not an exact figure, because real slippage varies from trade to trade and can be positive (a better-than-expected fill) as well as negative. Averaging over enough trades smooths out some of that variability, which is why this is a monthly-scale estimate rather than something meant to predict any single trade's outcome.
Why estimate this at all
Spread, commission, and swap are calculable in advance from your broker's published rates, as covered in our guides to lot, pip, and spread cost and swap and overnight fees. Slippage is different — it only exists after the fact, order by order, which makes it easy to overlook when adding up a monthly cost total. Estimating it, even roughly, gives a more complete picture of where your money is actually going each month, which is the same goal covered more broadly in our real monthly forex trading cost guide.
Building the estimate step by step
- Find your average slippage per trade, in pips. Some brokers publish execution-quality statistics showing average slippage across their client base; others require you to compute it yourself from your own trade history by comparing requested price to fill price across a sample of trades, a process related to the one covered in our guide to reading a broker's execution statistics.
- Multiply by pip value per lot, using the same formula from our pip value guide: (pip size × position size) ÷ exchange rate.
- Multiply by your average lot size per trade.
- Multiply by the number of trades placed that month. The result is your estimated total slippage cost for the month.
Worked example
Illustrative inputs: average slippage of 0.8 pips per trade (negative, i.e., a cost), pip value $10 per standard lot, average position size 0.5 lots, 40 trades placed in the month.
Estimated monthly slippage cost = 0.8 × $10 × 0.5 × 40 = $160.
This is a rough estimate built from an average — some of those 40 trades may have had zero or even positive slippage, while a handful during volatile conditions may have had considerably more than 0.8 pips. The average is what makes a monthly-scale estimate meaningful despite that trade-by-trade variability.
Where slippage sits next to your other costs
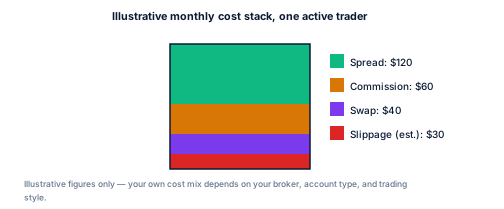
In a typical illustrative monthly breakdown, slippage tends to be the smallest of the four major cost categories — smaller than spread, and often smaller than commission or swap too — but "usually smallest" isn't the same as "always negligible." A few situations tend to push it higher relative to the rest:
- High trade frequency. Since the monthly estimate scales directly with number of trades, a high-frequency strategy accumulates estimated slippage cost faster than a low-frequency one, even at the same per-trade average.
- News-sensitive entries. Placing market orders around scheduled high-impact releases, as covered in our guide to how news trading affects your trading costs, tends to raise average slippage for those specific trades well above a trader's typical baseline.
- Large orders relative to available liquidity. Bigger average lot sizes multiply directly into the estimate, and very large orders can also experience worse per-trade slippage in thin markets, compounding both factors at once.
A second way to sanity-check the estimate
If tracking every fill individually feels like too much overhead, a rougher shortcut is to compare your actual monthly account result against the sum of your expected costs (spread, commission, and swap calculated from published rates) and your expected trading result. Any unexplained gap between the two, after accounting for normal rounding, is a rough proxy for combined slippage across the month — less precise than tracking each fill, but still more grounded than assuming an industry-wide average applies to your own account. This shortcut works best over a full month rather than a handful of trades, since a small sample is more likely to be dominated by one or two unusually large fills in either direction.
Tracking this in your own trading journal
The estimate above is only useful if you're feeding it real numbers from your own trading rather than industry assumptions. Our trading journal template for costs and rebates covers logging spread, commission, and swap per trade — adding a slippage column (expected price minus fill price, in pips) lets you compute your own running average rather than relying on an illustrative figure like the one in the worked example above. Over a few dozen trades, that average becomes meaningfully more reliable than a one-off estimate from a handful of trades.
Ways to reduce the estimate, not just calculate it
The estimate itself doesn't reduce your cost — but a few of the general cost-reduction approaches covered in our guide to reducing forex trading costs apply specifically to the slippage component: using limit orders where your strategy allows it, avoiding new market orders in the seconds around scheduled news if that's not central to your strategy, and checking your broker's published execution statistics before assuming a specific model produces better or worse fills than another.
Does a rebate offset this cost?
No, not directly. A cashback rebate is calculated on qualifying closed trading volume, as explained in our guide to how forex rebates work — it has no connection to the fill price any individual order received. That said, the rebate still reduces your combined monthly cost across whatever categories made it up, so a lower net monthly total (spread + commission + swap + slippage − rebate) is still the more complete way to look at your overall trading cost.
Related reading
- Slippage and requotes explained — the per-trade mechanics and formula this monthly estimate builds on.
- Real monthly forex trading cost — the fuller monthly cost picture, including spread, commission, and swap alongside this slippage estimate.
- Trading journal template for costs and rebates — where to log the per-trade data this estimate is built from.
Frequently asked questions
Multiply your average slippage per trade (in pips) by pip value per lot, by your average lot size, by the number of trades placed that month. This gives a rough estimate, not an exact figure, since real slippage varies trade by trade.
Work out your own numbers
Pull your own average slippage, pip value, average lot size, and trade count from your trade history and plug them into the formula above. To see what cashback would add back on your own monthly volume, try the cashback calculator, or register with CB-Dogs before your next trade.
Risk warning: forex and CFD trading carries a high risk of losing money. Cashback does not offset trading losses. Nothing here is investment advice.
Related articles
Cashback on your XM trades — free, paid in USDT
Sign up free